Nexan Tech
Sales Pipeline Analytics
Power BI | DAX | Power Query | AI
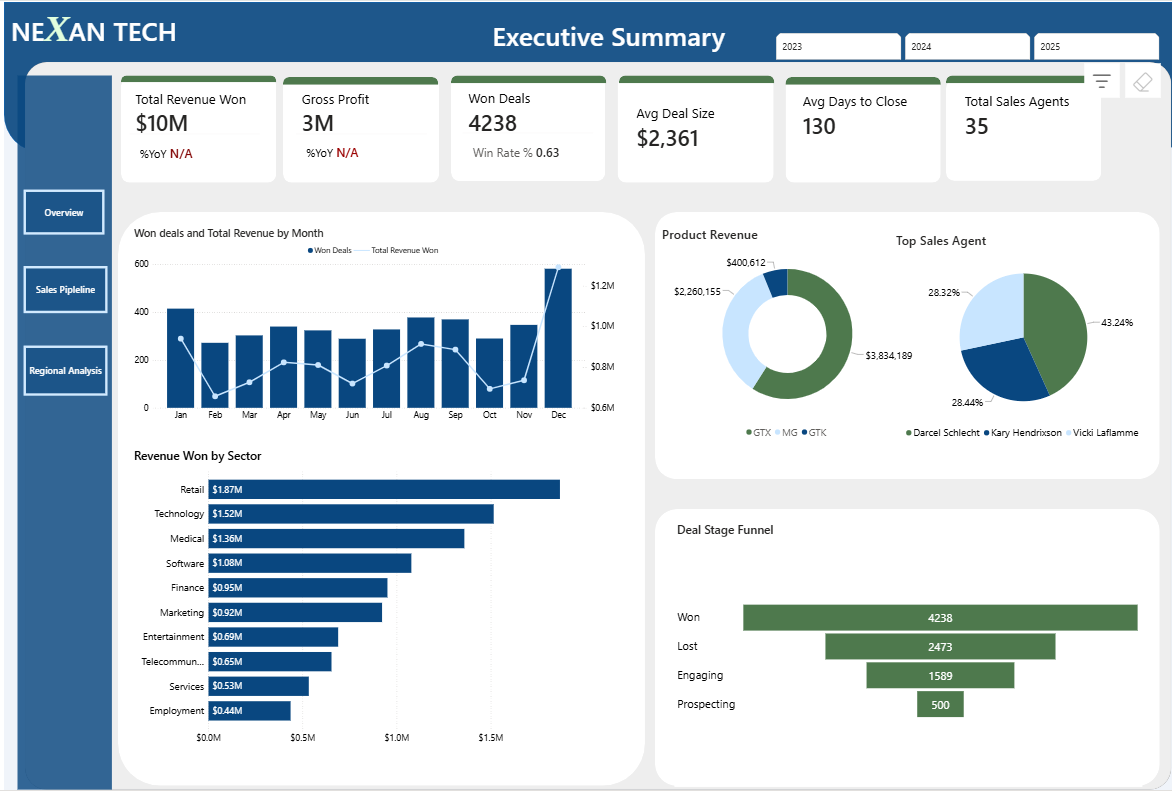
Built an automated Power BI Sales Pipeline report, analysing 8,800 B2B sales deals across FY2023–2025 to track revenue, profitability, sales performance, and regional trends.
The analysis identified $10M in revenue with a 63% win rate, while uncovering improving profit margins and underperforming regions requiring further investigation.
The project involved data modelling, DAX calculations, time intelligence reporting, and commercial analysis to turn raw sales data into clear business insights and recommendations.
Year
FY 2023 - 2025
Data Source:
Maven Analytics
Analysis
What the data shows
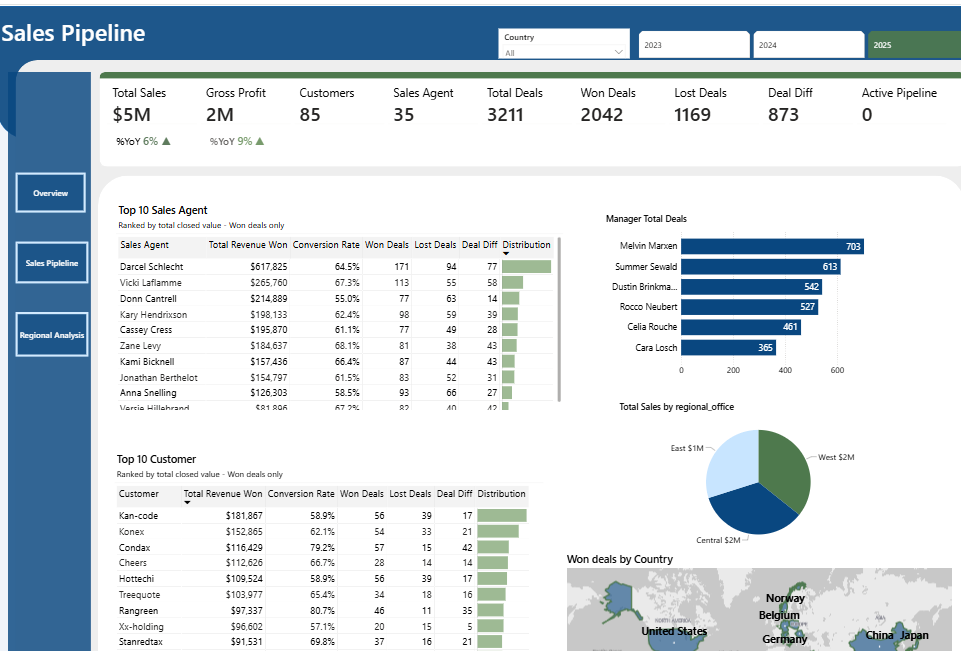
The business closed $10M across the period with a 63% win rate, which is solid for enterprise B2B. FY2024 is the strongest year. With $5M revenue, $2M gross profit, with average profit growing at 800% against revenue growth of 843%. That gap is the headline and it is due to the fact that FY 2023 data started from October 2023.
It means margins are improving, not just volume. The average sales cycle did creep up to 138 days in 2025 against a three-year average of 130, which is worth monitoring as the pipeline scales.
The below information focus on FY 2025
Products
GTK delivered $1.9M, GTX $1.1M, MG $187K. The first two are carrying the portfolio. MG is generating one-tenth of GTK's output with no clear strategic direction around it. What this is means is that, it either needs a commercial push or a decision to step back from it and focus resource where it's working.
Sectors
Retail leads at $950K, Technology at $750K. The commercial fit in those two verticals is clear. Employment, Services, and Telecoms are all under $320K with no real momentum. Before putting further resource behind them, the question worth asking is whether that's a targeting issue or a fit issue and this answer will change the response entirely.
Agents
Darcel Schlecht, Reed Clapper, and Vicki Laflamme sit at the top of the leaderboard, with Darcel accounting for nearly 40% of the top agent share. The concentration is a commercial vulnerability. Revenue alone is also an incomplete picture. Win rate, average deal size, and pipeline velocity per agent would give a much clearer view of where the real performance is and where the coaching conversations need to happen.
Regional: The most important finding
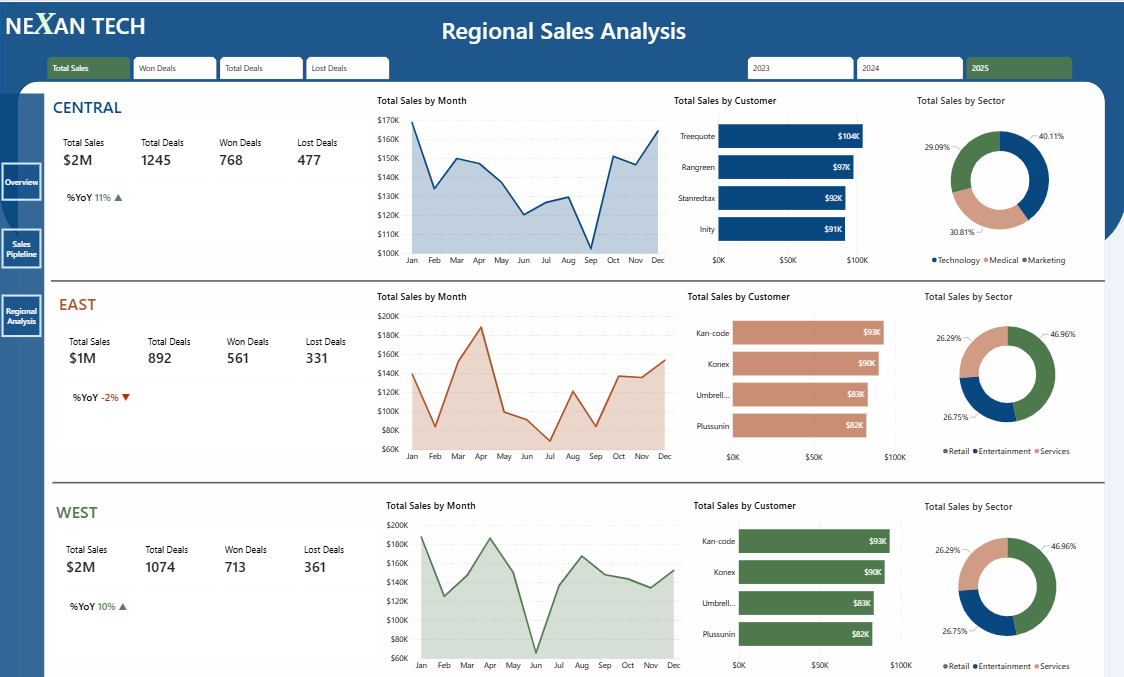
Central grew 11% YoY from 2024. West grew 10%. East declined 2%.
East has a higher proportional loss rate, a weaker sector mix, and a monthly trend that dropped sharply mid year before a partial recovery. This right here is a a pattern. The root cause here is whether it is either people, pipeline management, or product fit in that category. It needs to be identified before it becomes harder to reverse.
What I'd prioritise next
A proper drill-down into East by agent, deal stage, and sector. Connecting the dashboard to a live CRM for real-time pipeline visibility. Expanding the agent analysis beyond revenue. And a clear decision on MG.
How it was built
The original dataset ran from 2015 to 2017. I used AI to alter the dates to October 2023 through December 2025, while continuing with the intervals between records and the overall dataset.
The model follows a star schema; Sales Pipeline as the fact table, connected to Accounts, Products, and Sales Teams dimension tables. A dedicated DAX Date Table was created and marked as the official date table, which is a requirement for time intelligence functions to work correctly in Power BI. Twelve measures were developed across revenue, win rate, YoY and MoM comparisons, average deal size, and sales cycle length.
A few issues came up during the build. A silent relationship failure between two tables caused by a product name inconsistency, where one table had a space in the name, the other didn't. The time intelligence functions were returning blanks until the Date Table was properly marked. And the YoY formula was returning -100% at the edges of the dataset where no prior year existed. I updated it to return N/A in those cases so the KPI cards always display something accurate.
It is worth noting that the dataset has some significant gaps, there is no cost price data, no discount or pricing variance information. That does limit how far the analysis can go. Gross profit figures are estimated rather than exact, and some of the segmentation analysis that would be most useful in a real commercial setting, comparing enterprise accounts against SME, or understanding whether deal size varies by region, simply is not possible with the data available. The findings are directionally sound, but any decisions made from this would need to be validated against more complete data before acting on them.